Data Exploration

ENDIREH Data

Introduction

For ENDIREH’s data analysis, INEGI provides a violence metric estimator, which is calculated upon certain experiences of violence. On past tabs the mentioned estimation was obtained and through this exploration we will visualize the results.

Unfortunately, those estimations are per state and not per person, thus on past tabs a label for emotional violence was obtained. Secondly, this page will show the exploration of the distribution of the data in relation with those labels.

ENDIREH exploration

Throughout the data cleaning process the ENDIREH’s experienced violence metric was obtained for “General” “Emotional” and “Economic” violence. Exploration starts by looking at the moments of each type of violence:

Code
import pandas as pd
import numpy as np
import matplotlib.pyplot as plt
import matplotlib.style
import seaborn as sns
matplotlib.style.use('seaborn-pastel')

violence_df = pd.read_csv("data/violence_clean.csv")

data = np.array([violence_df["est_general"],
violence_df["est_econ"], violence_df["est_emot"]])
transpose = pd.DataFrame(data, columns=violence_df["states"])

violence_df = violence_df.drop(columns=["Unnamed: 0"])

#dropping national metric
violence_df = violence_df[violence_df.states != "Estados Unidos Mexicanos"]
#keeping states values
states=violence_df["states"]

v_gen_emot =  pd.DataFrame(data=[violence_df["est_general"], violence_df["est_emot"], violence_df["est_econ"]], index =["general", "emotional","economic"]).T

df_metrics = pd.DataFrame(data=[v_gen_emot.mean(), v_gen_emot.std(), v_gen_emot.skew(), v_gen_emot.kurtosis()], index =["Mean", 
"Standard Deviation",
"Skew",
"Kurtosis"]).T
df_metrics.head()
Mean Standard Deviation Skew Kurtosis
general 68.756861 5.367687 -1.658182 5.595716
emotional 50.772941 5.026683 -1.634302 4.500386
economic 27.505621 3.313554 -1.437172 3.894335

Mean: the average of experienced violence among states, separated by three violence types. From this value we can see how the economic violence values are smaller compared with the other types of violence

Standard deviation: how close the values are spread about the mean. given that our range goes from 0 to 55 a value between 3 and 5 can be considered small

Skewness: describes the shape of the distribution. the result were negative it means our distribution for all violence types are left-skewed

Kurtosis: measures the peakedness or flatness of a distribution. the result was around 4 and 5 for all violences and a positive kurtosis indicates a thin pointed distribution. Meaning we may have a small amount of outliers

The described values show the distribution of our data, from them we can expect a normal distribution with similar values, the next visualizations will help to observe the difference between the three distributions

Code
f, ax = plt.subplots(dpi=120)
sns.histplot(data=v_gen_emot["general"], kde=True, linewidth=0.5)
ax.set_title("General Violence", fontsize=16)
ax.set_ylabel("Frequency of violence estimation", fontsize=16)
ax.set_xlabel("Violence estimation units", fontsize=16)
Text(0.5, 0, 'Violence estimation units')

This plot shows the frequency of the the violence estimation, it describes how most of the states tend to have a general violence estimation around 70 units.

Code
f, ax = plt.subplots(dpi=120)
sns.histplot(data=v_gen_emot, kde=True, linewidth=0.5)
ax.set_title("Violence per type", fontsize=16)
ax.set_ylabel("Frequency of violence estimation", fontsize=16)
ax.set_xlabel("Violence estimation units", fontsize=16)
Text(0.5, 0, 'Violence estimation units')

By looking at the three values, the violence estimation for emotional and general or overall violence are closer to a higher range of violence and have a similar distribution while the economical value has a smaller range of violence and a higher frequency of values around 30 units of violence.

Since economic violence has a broader definition than the one analyzed on this work, and it’s behavior is not similar to the types of violence that are studied it will be removed.

Code
f, ax = plt.subplots(dpi=120)


sns.boxplot(data=[violence_df["est_emot"], violence_df["est_general"]],color = 'orange')
ax.set_title("Emotional Violence estimator", fontsize=16)
ax.set_xlabel("Violence type", fontsize=14)
ax.set_ylabel("General Violence estimator", fontsize=16)
ax.set_xticklabels(["Emotional", "General"])

sns.despine()

Focusing on the emotional and general violence distribution, as seen on the past plot, the emotional violence mean is around 50 units with outliers around the 40 unit value. Meanwhile, General violence mean goes up to 70 units, with more sparse outliers.

The next visualization will help us understand those outliers.

Code
import warnings
warnings.filterwarnings('ignore')
import seaborn as sns
from seaborn_qqplot import pplot
import numpy as np
import matplotlib.pyplot as plt
import matplotlib.style
matplotlib.style.use('ggplot')

f, (ax1, ax2) = plt.subplots(ncols=2, dpi=150, )

sns.barplot(x='states',
            y='est_general',
            data=violence_df,
            order=violence_df.sort_values('est_general').states,
            color = 'orange',
            ax=ax1,)
ax1.set(ylim=(40, 80))
ax1.set_ylabel("Violence estimator", fontsize=12)
ax1.set_xlabel("Mexico States", fontsize=12)
ax1.set_title("General violence per state", fontsize=12)

sns.barplot(x='states',
            y='est_emot',
            data=violence_df,
            order=violence_df.sort_values('est_emot').states,
            color = 'violet',
            ax=ax2)
ax2.set(ylim=(40, 80))
ax2.set_ylabel("", fontsize=16)
ax2.set_xlabel("Mexico States", fontsize=12)
ax2.set_title("Emotional violence per state", fontsize=12)

ax1.set_xticklabels(states,rotation=90, fontsize=5)
ax2.set_xticklabels(states,rotation=90, fontsize=5)
[Text(0, 0, 'Aguascalientes'),
 Text(1, 0, 'Baja California'),
 Text(2, 0, 'Baja California Sur'),
 Text(3, 0, 'Campeche'),
 Text(4, 0, 'Coahuila de Zaragoza'),
 Text(5, 0, 'Colima'),
 Text(6, 0, 'Chiapas'),
 Text(7, 0, 'Chihuahua'),
 Text(8, 0, 'Ciudad de México'),
 Text(9, 0, 'Durango'),
 Text(10, 0, 'Guanajuato'),
 Text(11, 0, 'Guerrero'),
 Text(12, 0, 'Hidalgo'),
 Text(13, 0, 'Jalisco'),
 Text(14, 0, 'Estado de México'),
 Text(15, 0, 'Michoacán de Ocampo'),
 Text(16, 0, 'Morelos'),
 Text(17, 0, 'Nayarit'),
 Text(18, 0, 'Nuevo León'),
 Text(19, 0, 'Oaxaca'),
 Text(20, 0, 'Puebla'),
 Text(21, 0, 'Querétaro'),
 Text(22, 0, 'Quintana Roo'),
 Text(23, 0, 'San Luis Potosí'),
 Text(24, 0, 'Sinaloa'),
 Text(25, 0, 'Sonora'),
 Text(26, 0, 'Tabasco'),
 Text(27, 0, 'Tamaulipas'),
 Text(28, 0, 'Tlaxcala'),
 Text(29, 0, 'Veracruz de Ignacio de la Llave'),
 Text(30, 0, 'Yucatán'),
 Text(31, 0, 'Zacatecas')]

The bar-plot is showing the Violence unit value per state by violence type. It is interesting how the violence behaves the same among states for general and emotional violence, based on this we can develop a hypothesis to understand if those two are related. On a real life example, the probability of emotional violence occurring once physical violence occurs is expected.

Finally we will visualize the balance of the labeled set that was previously created:

Code
import pandas as pd
df_endireh = pd.read_csv('data/endireh_ev.csv')
print(df_endireh.shape)
df_endireh.head()
(73500, 354)
P12_1 P12_2 P12_3 P12_4 P12_5 P12_6 P12_7 P12_8 P12_9 P12_10 ... P4_13_4 P4_13_5 P4_13_6 P4_13_7 FAC_VIV_y.1 FAC_MUJ_y.1 ESTRATO_y.1 UPM_DIS_y.1 EST_DIS_y.1 label
0 2 2 3 1 1 1 1 2.0 2.0 1.0 ... 1.0 NaN NaN NaN 113 113 4 1 3 0.0
1 2 1 2 3 1 3 3 8.0 8.0 3.0 ... 1.0 NaN NaN NaN 113 113 4 1 3 1.0
2 1 1 3 3 3 3 3 8.0 8.0 3.0 ... NaN NaN NaN NaN 113 227 4 1 3 0.0
3 1 1 3 3 3 1 3 1.0 2.0 4.0 ... 5.0 NaN NaN NaN 113 113 4 1 3 0.0
4 2 1 1 3 3 3 1 3.0 8.0 1.0 ... 2.0 NaN NaN NaN 78 155 2 2 1 0.0

5 rows × 354 columns

As we can see the endireh survey has a shape of 73,500 answers and 354 questions where each question is represented by numbers and a sub-index which represents relations between questions.

It would be complex to go manually through all the features thus the purpose of next tabs is to use different models to understand how they statistically relate to each other.

Code
def check_balance(df):
    return (df.label.value_counts())
balance = check_balance(df_endireh)

bal_plot = {"emotional violence":balance[0],
"no emotional violence":balance[1]}
keys = list(bal_plot.keys())
vals = [bal_plot[k] for k in keys]

f,ax = plt.subplots(dpi=150,)
sns.barplot(x=keys, y=vals,
            color = 'orange')
ax.set_ylabel("Number of cases", fontsize=12)
ax.set_xlabel("Classes", fontsize=12)
ax.set_title("Emotional violence", fontsize=12)
Text(0.5, 1.0, 'Emotional violence')

Our check balance functions helps to visualize how many datapoints are contained on each class. The two classes (0 no emotional violence and 1 emotional violence) are unbalanced having a bigger number of women that have gone through emotional violence.

Twitter Data

A small step of exploration was done before jumping into the cleaning portion, manually it was easy to notice that the majority of tweets had noise, since many latin characters such as ñ or á ó were not obtained correctly. Thus, an extra step was added to the cleaning phase to remove those.

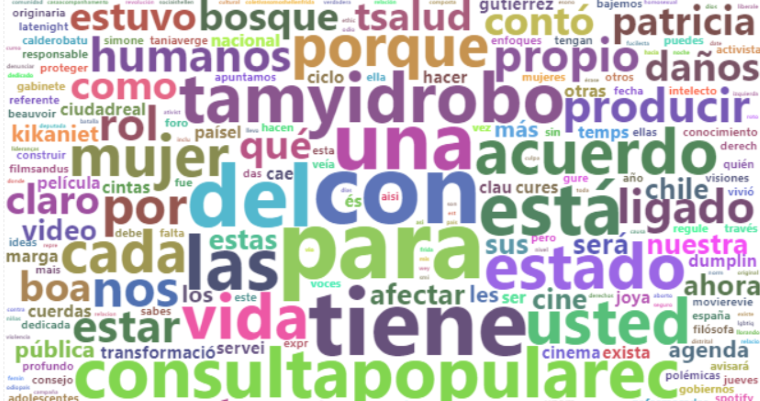
Afterwards the tweets_exploration.py and tweets_exploration.r scripts were used to obtain, the frequency of the words after being cleaned, finally both are able to generate a wordcloud

Code


words <- sort(rowSums(tdm), decreasing = TRUE) # count all occurrences of each word and group them
df <- data.frame(word = names(words), freq = words) # convert it to a dataframe
head(df) # visualize!
set.seed(1234) # for reproducibility
wcloud <- wordcloud2(df,   # generate word cloud
                     size = 1.5,
                     color= 'random-dark', # set colors
                     #shape = 'pentagon',
                     rotateRatio = 0) #horizontal
wcloud
"\nwords <- sort(rowSums(tdm), decreasing = TRUE) # count all occurrences of each word and group them\ndf <- data.frame(word = names(words), freq = words) # convert it to a dataframe\nhead(df) # visualize!\nset.seed(1234) # for reproducibility\nwcloud <- wordcloud2(df,   # generate word cloud\n                     size = 1.5,\n                     color= 'random-dark', # set colors\n                     #shape = 'pentagon',\n                     rotateRatio = 0) #horizontal\nwcloud\n"

The wordcloud provides an insight in the words of the dataset and their frequency, but it also helps to visualize some other contexts. For example while capturing these data a political movement occured in México thus the words “consulta popular” appear in the WordCloud. Language can provide representation not only about sentiment but also about the understanding of an important event.

After looking at general metrics an exploration step was performed through multiple visualizations. The most important fact to understand through them is if there are any extra steps needed to be performed through the “cleaning” phase, over again.